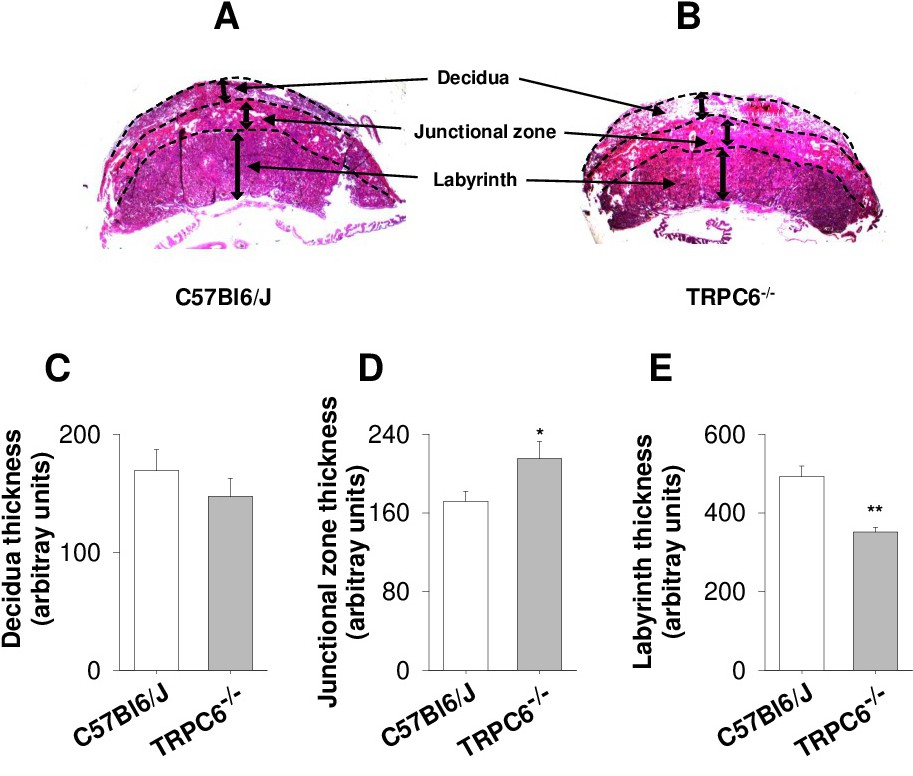
Fig. 2. Analysis of the placental layers. Panels A-B shows parasagittal sections of placentas from C57Bl6/J (A) and TRPC6-/- mice (B) collected at E13 to identify the placental layers (decidua, junctional zone, and labyrinth). Panels C-E are bar graphs comparing the thickness of each placental layer in C57Bl6/J and TRPC6-/- mice. Two parasagittal sections per placenta were analyzed with at least three placentas collected from three different mice. Mean ± SEM (* p<0.05, ** p<0.01 Student's t test).